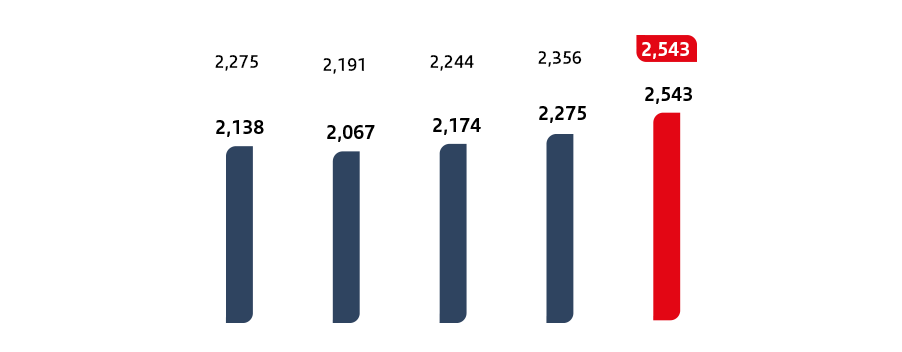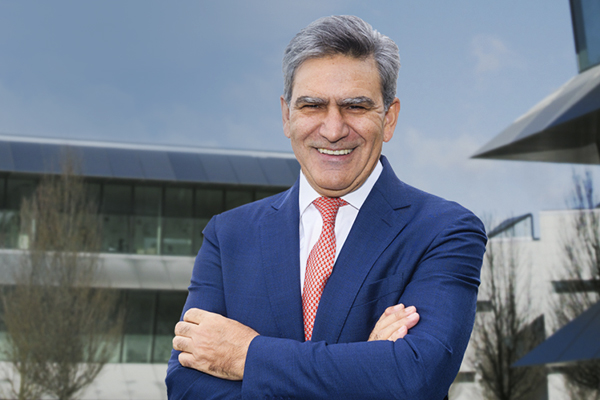
"Profit was above 2.5 billion euros, and we saw an improvement of profitability of our main ratios."
Welcome to the Quarterly Shareholder Report where you can check the most significant information about Santander's share and the Group in the first quarter of 2022.
Browse from the home page to access each of the sections or move the cursor downwards to view the complete report.


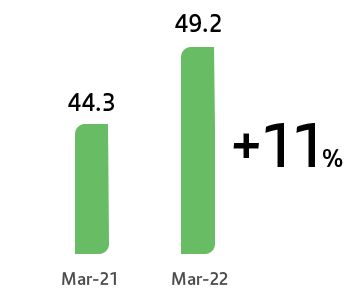
 Constant euros
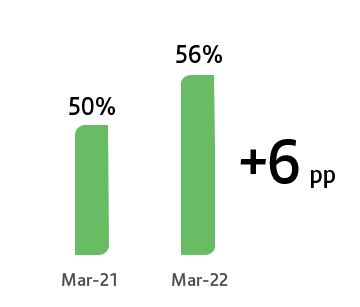