The second quarter of 2023 was again characterized by inflationary pressures, which, despite having declined, remain persistently high. The main central banks continued to rise interest rates, albeit at different speeds.
The Federal Reserve, after a 25bp increase in May, paused raising rates in June to properly assess their impact on the economy, leaving rates at 5.25%.
The European Central Bank, eased its rate up by 25bps at each of its last two meetings to 4.00%, while the Bank of England surprised the market with a 50 bp rise to 5.00% at the June meeting, following the acceleration in core inflation.
In this context, the main central banks maintained that it is too early to say that their ceiling was reached and predicted possible rises in the following meetings.
All in all, the global economy remained resilient, with better prospects for 2023 than forecast at the beginning of the year, mainly due to strength in US household spending, lower gas prices in Europe, the reopening of China, the end of the global covid-19 health emergency announced by the World Health Organization in May, and the robustness of the labour market in many economies.
The European financial sector maintained a positive performance after first quarter turbulence, mainly due to the isolated crises suffered by some American banks, which subsequently affected Credit Suisse, and to the uncertainty in the debt ceiling negotiations in the US.
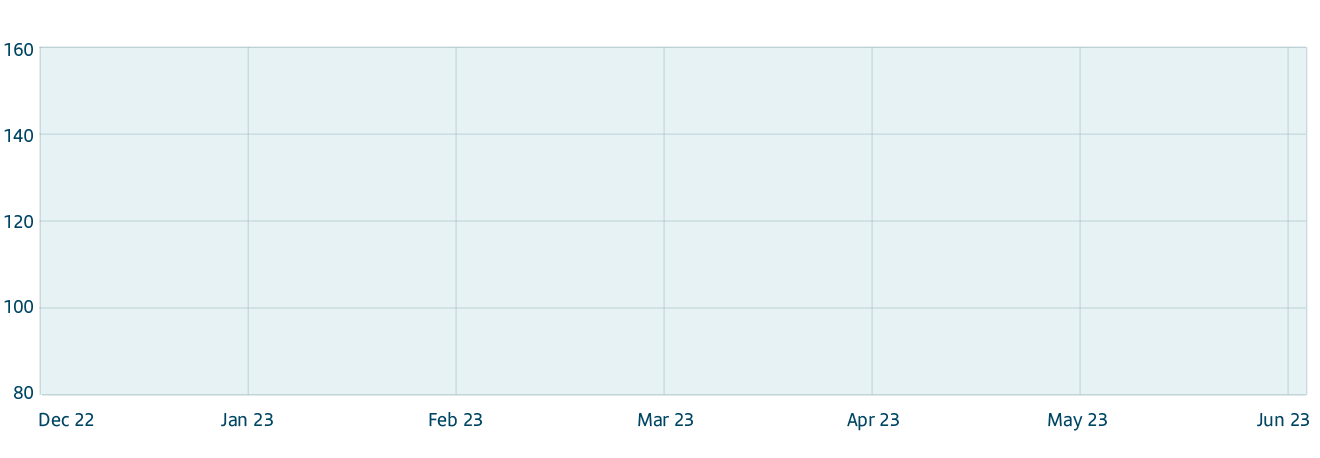
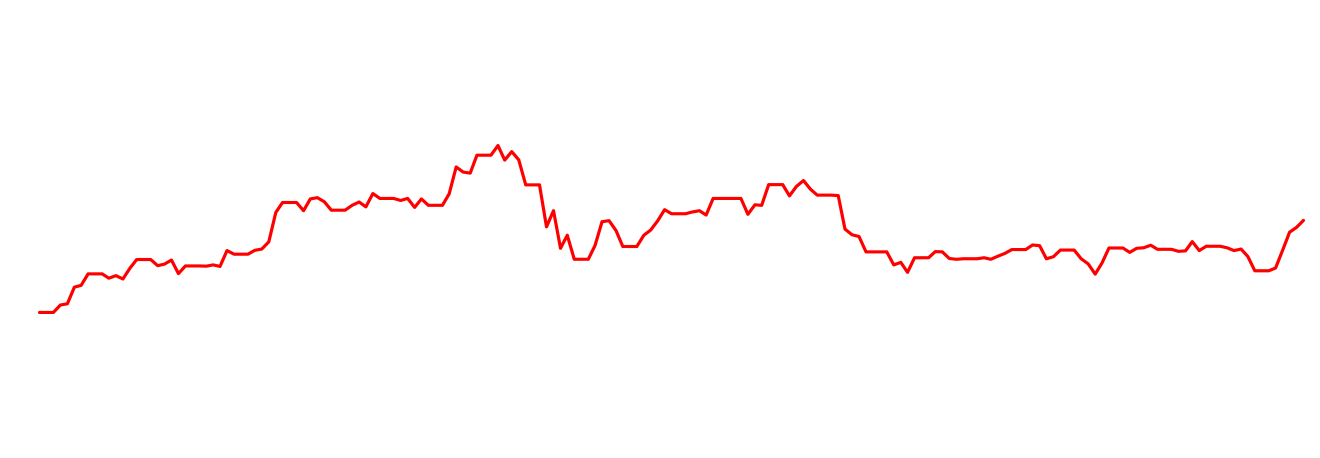
The Santander share price ended the quarter with a positive return of 21%, outperforming the market in relative terms. In the banking sector, EuroStoxx Banks was up 12%, DJ Stoxx Banks increased 11% and MSCI World Banks decreased slightly 0.2%. The other main indices closed up, Ibex 35 +17% and DJ Stoxx 50 +10%.


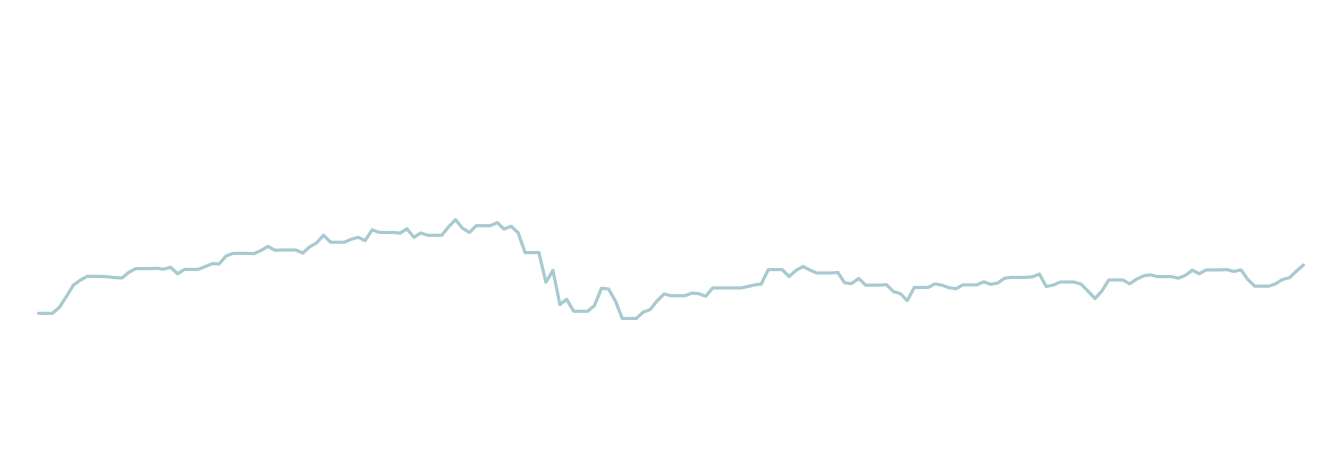


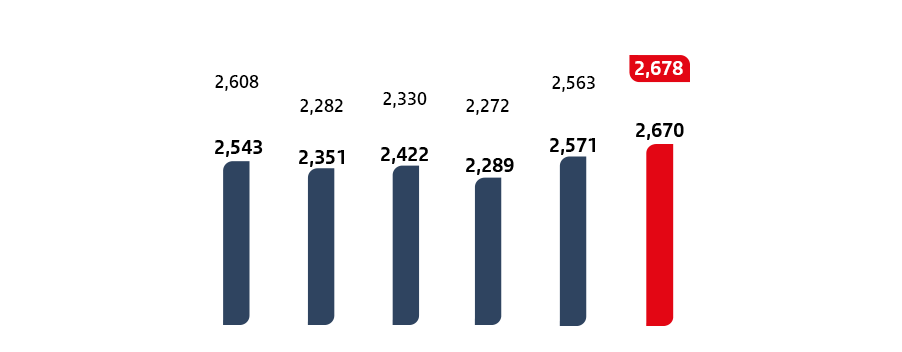
 Constant euros
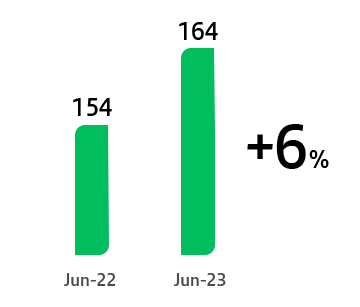