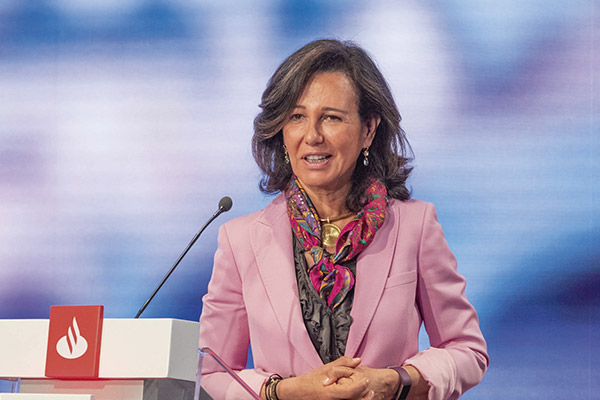
"In 2021, Santander made the highest profit before tax in a single year in our history.”
Welcome to the Quarterly Shareholder Report where you can check the most significant information about Santander's share and the Group in the fourth quarter of 2021.
Browse from the home page to access each of the sections or move the cursor downwards to view the complete report.


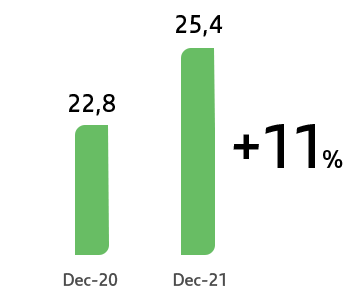
 Constant euros
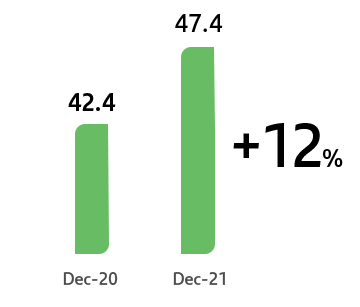
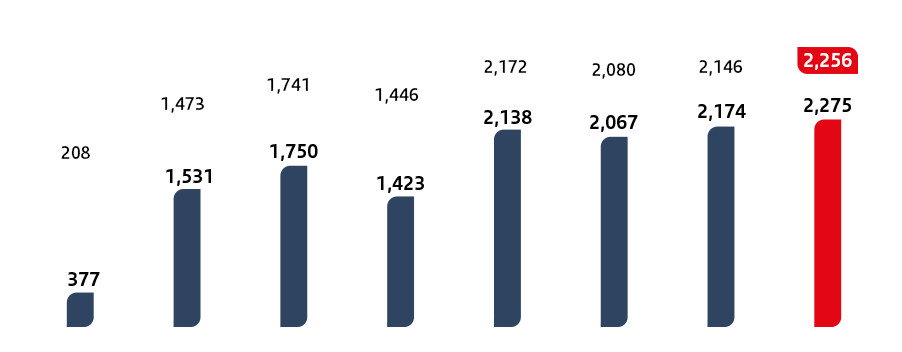
Building a more inclusive society
7.5 mn
People financially empowered since 2019
1.4 mn
Microentrepreneurs supported since 2019
> €550 mn
Credit allocated to microfinance in 2021
8
Countries with microfinance initiatives underway
(1) Only SCIB global business.
(2) All segments excluding SCIB and WM&I.
(3) AuMs classified as Article 8 and 9 funds (SFDR) from SAM, plus third-party funds and other ESG products according to EU taxonomy from Private Banking. We apply equivalent ESG criteria to SAM's funds in Latin America.
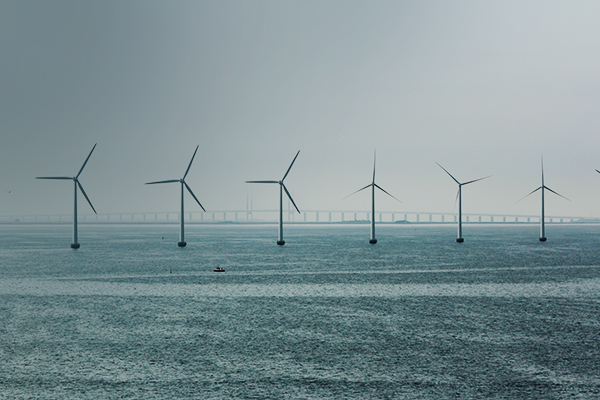
(4) Banco Santander SA emerged as the top financial adviser for renewable energy project financing in 2021, with a total deal credit of $10.3 billion and a market share of 28%, according to Bloomberg NEF’s 2H 2021 Clean Energy League Tables.