RESULTS

Solid business model based on customers, scale and diversification, which enables us to obtain profits on a recurring basis

First quarter attributable profit to the parent of EUR 331 million, including a net negative impact of EUR 1,646 million that is outside the ordinary course performance of our business, of which EUR 1.6 billion corresponds to the creation of a provisions overlay based on the expected deterioration of the macroeconomic conditions arising from the health crisis.

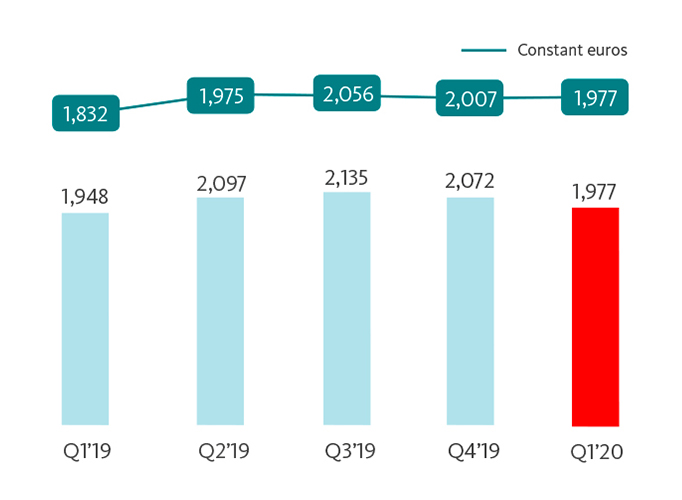
Excluding these charges, underlying attributable profit of 1,977 million euros, 1% more than in the same period of 2019 (+ 8% without exchange rate impact).

Results, marginally affected by the crisis, continued to reflect a solid underlying trend in constant euros:
Customer revenue continued to increase.

Costs continue to reflect the synergies obtained in various units.

Cost of credit remained stable.

Quarterly performance of underlying attributable profit to the Group*

eur million

*Excluding net capital gains and provisions.

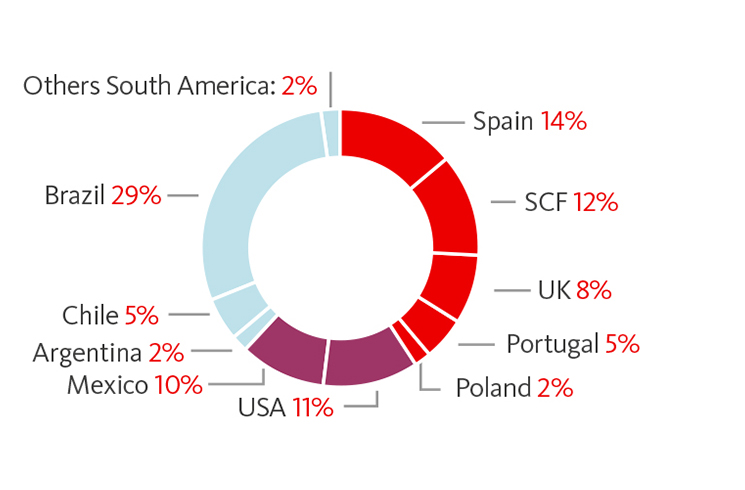
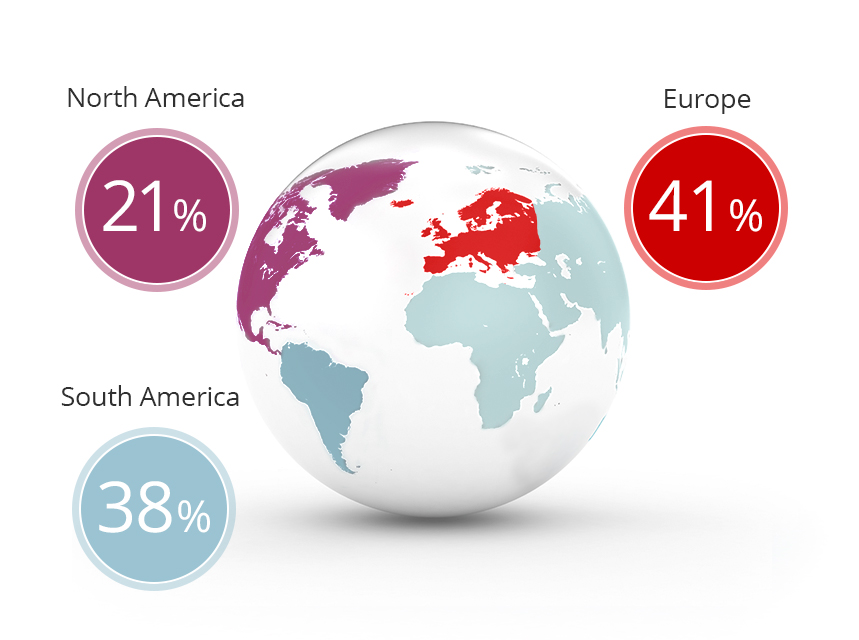
underlying attributable profit geographic distribution*

Well balanced Group profit by regions. January – March 2020

(*) As a % of operating areas. Excluding Corporate Centre and Santander Global Platform.

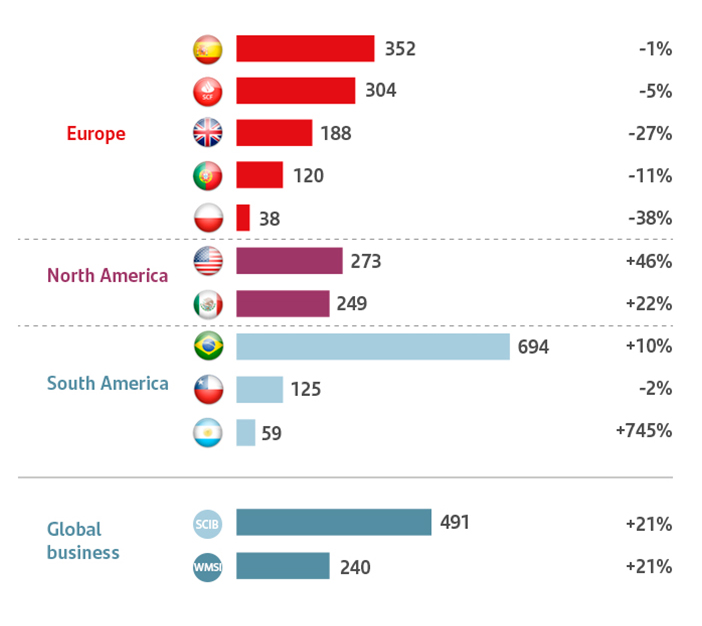
underlying attributable profit Q1'20. CORE MARKETS

EUR million. % CHANGE YoY IN CONSTANT EUROS

Delivered profit growth driven by the Americas and global businesses

The information shown above in relation to the different units has been prepared in accordance with homogeneous management criteria for the whole Group and may therefore differ from the information published for each company on an individual basis.

Main business areas performance

Changes in constant euros

North America

The US and Mexico are managed according to their local strategic priorities, while increasing coordination and cooperation between the two units.

In results, underlying attributable profit increased 34% year-on-year, driven mainly by customer revenue, improved efficiency and reduced non-controlling interests.

Europe

In the current environment, we are continuing to work to simplify our business model and our structures and accelerate digital transformation.

Underlying attributable profit amounted to EUR 974 million, down 16% compared to 2019, due to lower customer revenue and higher provisions (partly due to portfolio sales in SCF in Q1'19). Costs improved 3%, with good performance in all markets, reflecting the optimisation measures.

South America

The focus remained on the integration of the region, through a wide range of products and services, with a strategy oriented to delivering profitable growth, improving customer satisfaction and loyalty as well as risk control.

Underlying attributable profit increased by 15% year-on-year backed by net interest income, net fee income and improved efficiency.

North America
The US and Mexico are managed according to their local strategic priorities, while increasing coordination and cooperation between the two units.

In results, underlying attributable profit increased 34% year-on-year, driven mainly by customer revenue, improved efficiency and reduced non-controlling interests.

Europe
In the current environment, we are continuing to work to simplify our business model and our structures and accelerate digital transformation.

Underlying attributable profit amounted to EUR 974 million, down 16% compared to 2019, due to lower customer revenue and higher provisions (partly due to portfolio sales in SCF in Q1'19). Costs improved 3%, with good performance in all markets, reflecting the optimisation measures.

South America
The focus remained on the integration of the region, through a wide range of products and services, with a strategy oriented to delivering profitable growth, improving customer satisfaction and loyalty as well as risk control.

Underlying attributable profit increased by 15% year-on-year backed by net interest income, net fee income and improved efficiency.

Income statement

EUR MILLION
% change vs Q1'19
Q1'20 EUR Constant
EUR
Net interest income 8,487 (2.2) 2.7
Gross income 11,814 (2.2) 2.7
Net operating income 6,237 (1.4) 4.5
Underlying profit before tax* 3,556 (3.5) 2.8
Underlying attributable profit to the Group* 1,977 1.5 7.9
Attributable profit to the Group 331 (82.0) (80.2)
*Excluding net capital gains and provisions.

FINANCIAL REPORT JANUARY - MARCH 2020